In this writing will discuss about how to use the chart in Delphi 7. In the example that is made by using Delphi 7, chart will appear 2 data in the form of incremental data number, the first data named data 1 and the second data named data 2. Data 1 is incremental data 1 that is begun from 0 until 10; while data 2 is same. Yet, in the beginning condition of data 1 start from 0 while data 2 start from 1.
To make application as the explanation above, please enter the components in the table below into design form.
No | Component | Properties | Value | Note |
| 1 | Form1 | Caption | The Chart of Data on Delphi 7 | |
| 2 | GroupBox1 | Caption | The Chart of Data on Delphi 7 | |
| 3 | Label1 | Caption | Data 1 | |
| 4 | Label2 | Caption | Data 2 | |
| 5 | Edit1 | Text | 0 | |
| 6 | Edit2 | Text | 0 | |
| 7 | Button1 | Caption | Show to Chart | |
| 8 | Button2 | Caption | Close | |
| 9 | Timer1 | Enabled | False | |
| 10 | Chart | - | - | Check the Note |
| Note: Double click on chart component, set the property of chart as below:  Click on Add.. Button Then the following chart gallery will be shown:  Choose the Fast Line an then Press OK  Add 1 series again (the steps same with the steps before), so will appear 2 series like the picture below:  To set the variable of vertikal dan horizontal series, please click on axis tab  And then click at tittle sub tab, | ||||
Arrange the design form visualization so that become like the following picture below:

Picture, Delphi application design using chart
Enter the source code below.| Component Name | Event | SOURCE CODE |
| Form1 | Form Create | data1:=0; data2:=0; |
| Button1 | OnClick | data1:=0; data2:=1; timer1.Enabled:=true; |
| Button2 | OnClick | application.Terminate; |
| Timer1 | OnTimer | if data1<10 then inc(data1); if data2<10 then inc(data2); if data1>=10 then data1:=0; if data2>=10 then data2:=0; edit1.Text:=inttostr(data1); edit2.Text:=inttostr(data2); chart1.Series[0].Add(data1,timetostr(now),cllime); chart1.Series[1].Add(data2,timetostr(now),clblue); |
Before execute the program, please declare 2 kind global variable and give it name data 1 and data 2 with integer data type as the following picture below;
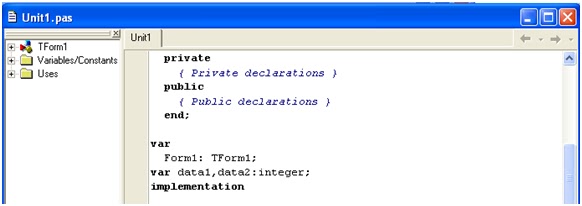
picture variable declaration
Please execute the application that had been made, will appear as follows:
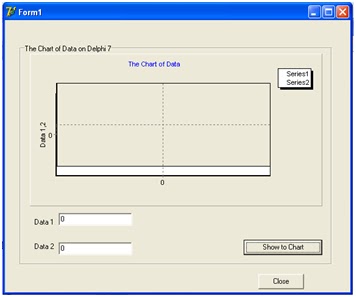
Picture. The result of application execution that had been made.
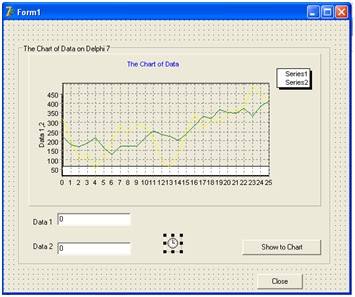
This following is the application picture when it is run
click the (Show Chart Button)

Picture. The result of application execution when it is run.
or just press like button under this posting
I hope this article can give benefit to the visitors, readers, developer and me. Thanks for visiting and availability for sharing this article by pressing
 | Share this on Facebook |

1 comment:
How to connect serial port (sensor HC-SR04+arduino UNO) and receive in graphic
Post a Comment